An In-Depth Look at 10 Popular Day Trading Options
Introduction
Day trading is a dynamic form of trading that involves buying and selling financial assets within the same trading day to profit from short-term price movements. Day traders seek to capitalize on both rising and falling markets, making quick, frequent trades. To understand the world of day trading, it’s important to explore the various options available to traders. In this article, we’ll take an in-depth look at 10 of the most popular day trading options, explaining each in detail.
- Stocks
Day trading in stocks involves buying and selling individual company shares with the aim of making a profit within the same trading day. Traders analyze stock price charts, news, and technical indicators to identify short-term opportunities. Stocks are widely traded, making them a favorite choice for day traders.
- Futures
Futures contracts are agreements to buy or sell an asset (like oil or stock indices) at a predetermined price on a specific future date. Day traders use futures for short-term speculation on whether the price of these assets will go up or down.
- Options
Options are derivative contracts that grant the holder the right (but not the obligation) to buy (call) or sell (put) an underlying asset at a specified price (strike price) on or before an expiration date. Day traders use options for speculative purposes and employ various strategies to profit from price changes.
- Forex (Foreign Exchange)
Forex trading involves the exchange of currency pairs, where one currency is traded for another. Day traders in the forex market aim to profit from small fluctuations in exchange rates. Major currency pairs, like EUR/USD and GBP/USD, are popular choices due to their liquidity.
- Cryptocurrencies
Cryptocurrency markets offer day traders the opportunity to trade digital currencies such as Bitcoin and Ethereum. These markets are known for extreme volatility, providing ample opportunities for short-term trading.
- Commodities
Commodity day trading focuses on predicting the price movements of natural resources like gold, oil, and agricultural products. Traders analyze supply and demand dynamics, geopolitical events, and other factors influencing commodity prices.
- Indices
Index day trading involves trading futures or options contracts linked to stock market indices such as the S&P 500. Day traders use these instruments to speculate on the overall market’s movements.
- Binary Options
Binary options are straightforward bets where traders predict whether the price of an asset will go up or down in a short timeframe, often just minutes. These options offer a fixed payout upon successful prediction.
- ETFs (Exchange-Traded Funds)
ETFs are investment funds that trade on stock exchanges, offering diversification across a group of assets, such as stocks, bonds, or commodities. Day traders use ETFs to speculate on the performance of entire sectors or market indices.
- Bonds
Bonds represent IOUs from governments or companies. Day traders focusing on bonds aim to profit from interest rate changes and economic events affecting bond prices.
Conclusion
Each of these day trading options has its unique characteristics and risks. To excel in day trading, it’s vital to choose the option that aligns with your trading strategy and risk tolerance, and to develop a sound trading plan. Moreover, effective risk management and continuous learning are essential for navigating the complexities of day trading successfully. While day trading can be challenging, it can also be rewarding when approached with a well-thought-out strategy and adequate knowledge.
There are various techniques and methods to analyze the trading market, each offering unique insights into price movements and potential investment opportunities. Here are some of the most commonly used techniques:
Fundamental Analysis:
This method involves examining a company’s financial health, earnings, revenues, and other factors to assess the intrinsic value of a stock or asset. It’s particularly useful for long-term investors.
Technical Analysis:
Technical analysis involves studying historical price and volume data to identify patterns and trends. Common tools in technical analysis include charts, indicators, and oscillators.
Sentiment Analysis:
This approach assesses market sentiment and investor psychology by analyzing news, social media, and other sources of information to gauge the overall mood of the market.
Chart Patterns:
Chart patterns, such as head and shoulders, flags, and triangles, are formations on price charts that traders use to predict future price movements.
Candlestick Patterns:
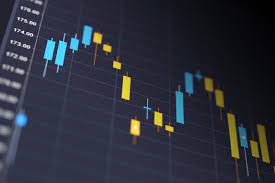
Candlestick patterns are specific formations of candlestick charts that provide insights into market sentiment and potential reversals or continuations.
Moving Averages:
Moving averages are calculated by averaging a set number of past price points. Traders use moving averages to identify trends and potential entry or exit points.
Support and Resistance Levels:
Support levels are price points at which an asset tends to find buying interest, while resistance levels are where selling interest typically occurs. Traders use these levels to make trading decisions.
Fibonacci Retracement:
Fibonacci retracement levels are percentages based on the Fibonacci sequence. Traders use these levels to identify potential areas of price reversal.
Relative Strength Index (RSI):
The RSI is an oscillator that measures the speed and change of price movements. It’s used to identify overbought or oversold conditions in the market.
Moving Average Convergence Divergence (MACD):
MACD is another oscillator that helps traders identify changes in the strength, direction, momentum, and duration of a trend.
Bollinger Bands:
Bollinger Bands consist of a moving average and two standard deviation lines. They help traders visualize volatility and potential price reversal points.
Elliott Wave Theory:
This complex theory suggests that financial markets move in predictable waves. Traders use this theory to anticipate future price movements.
Volume Analysis:
Analyzing trading volume can provide insights into the strength or weakness of price movements. It’s often used in conjunction with other analysis techniques.
Algorithmic Trading:
Some traders use computer algorithms to execute trades based on predefined criteria. These algorithms can analyze market data and execute orders much faster than humans.
Machine Learning and AI:
Advanced traders and institutions use machine learning and artificial intelligence to analyze vast amounts of market data and develop predictive models.
Options Analysis:
Traders and investors use options pricing models to analyze the implied volatility and expected price movements of the underlying asset.
Quantitative Analysis:
Quantitative analysts use mathematical and statistical models to evaluate the performance of financial instruments and make trading decisions.
Economic and Events Calendar:
Traders keep track of economic releases, earnings reports, and geopolitical events that can significantly impact market movements.
It’s important to note that there is no one-size-fits-all approach to market analysis, and different traders may use a combination of these techniques to make informed decisions. The choice of method often depends on the trader’s trading style, goals, and the specific market they are analyzing.

